Phase diagram of a pure substance
[1]:
import feos
import si_units as si
import matplotlib.pyplot as plt
import seaborn as sns
import pandas as pd

sns.set_context('talk')
sns.set_palette('Dark2')
sns.set_style('ticks')
colors = sns.palettes.color_palette('Dark2', 1)
[2]:
parameters = feos.Parameters.from_json(
    substances=['methanol'],
    pure_path='../../parameters/pcsaft/gross2002.json'
)
eos = feos.EquationOfState.pcsaft(parameters)
phase_diagram = feos.PhaseDiagram.pure(eos, 150.0 * si.KELVIN, 201)
[3]:
fig, ax = plt.subplots(1, 2, figsize=(15, 6))
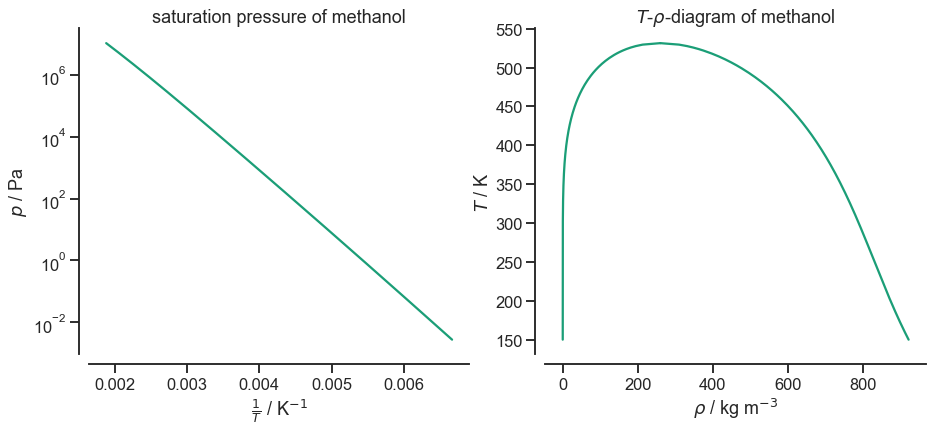
ax[0].set_title(
"saturation pressure of {}".format(
parameters.pure_records[0].identifier.name
)
)
sns.lineplot(
y=phase_diagram.vapor.pressure / si.PASCAL,
x=1.0/phase_diagram.vapor.temperature * si.KELVIN,
ax=ax[0]
)
ax[0].set_yscale('log')
ax[0].set_xlabel(r'$\frac{1}{T}$ / K$^{-1}$')
ax[0].set_ylabel(r'$p$ / Pa')
#ax[0].set_xlim()
#ax[0].set_ylim()
ax[1].set_title(
r"$T$-$\rho$-diagram of {}".format(
parameters.pure_records[0].identifier.name
)
)
sns.lineplot(
y=phase_diagram.vapor.temperature / si.KELVIN,
x=phase_diagram.vapor.mass_density / si.KILOGRAM * si.METER**3,
ax=ax[1],
color=colors[0]
)
sns.lineplot(
y=phase_diagram.liquid.temperature / si.KELVIN,
x=phase_diagram.liquid.mass_density / si.KILOGRAM * si.METER**3,
ax=ax[1],
color=colors[0]
)
ax[1].set_ylabel(r'$T$ / K')
ax[1].set_xlabel(r'$\rho$ / kg m$^{-3}$')
#ax[1].set_ylim()
#ax[1].set_xlim()
sns.despine(offset=10)